First, a couple of definitions:
If more compound is leaving a volume element than is entering into a volume element, then flux is a negative quantity. Thus, in the measurement of flux at any point in time (static model), the amount of material leaving an area is greater than that entering into an area in proportion to the concentration of material present in the area. The mathematical statement is given by Fick's First Law:
Fick's First Law: ![]()
where: D = diffusion coefficient
The diffusion coefficient is a property of a compound which depends on the size, shape, and degree of solvation. As we add more compound to a volume element in time, the system must respond in a manner consistent with Fick's first law; the concentration gradient that builds with time must be relieved by an increase in diffusion. The more compound that we pile into a volume element, the greater the amount of diffusion. This can be stated mathematically by the equation:
Combining this expression with Fick's first Law:
The completely differentiated expression is given by Fick's Second Law:
The physical interpretation of this expression is that the more a compound is added to a volume element, the greater the amount of diffusion of the compound from the volume element. The extent of diffusion is given by the second derivative of the spatial concentration. In three dimensions, the amount of diffusion would be equal to the gradient. It will be easier to view this process of diffusion by an example.
Example:
A thin layer of sample solution is applied to a separation column in a quantity w (g/cm2). For simplicity of the model, we can assume that the compound is applied as a d function. A d function is one which is infinite at one value in space or time and zero at every other position. Though a d function is a physical impossibility because all samples have some finite width, it serves as a reasonable model for a thin sample plug applied to a chromatography column. In time, the d function quickly degrades to a Gaussian function. The Gaussian function is given by the equation:
Therefore, if we apply an infinitely thin solvent zone to a separation column, in time it will diffuse to form a Gaussian peak. The figures below show the first and second derivatives of a peak starting with a d function. As chromatographers, we always ask the important question: how wide will a chromatographic peak be after a time on a separation column?
In 1905, Einstein derived an equation relating the mean square displacement to time:
What is mean square?
So the mean displacement is given by the relation:
We will use this equation to derive the general form of band spreading on a chromatography column and we will also see that the Gaussian shape can be derived from a somewhat different approach (which may be more enlightening). But before we do that. let's use the diffusion information to derive information about the properties of a biomolecule in solution. To do this we must go back to a physical description of the movement of molecules in solution.
In a vacuum, a molecule can be accelerated as long as an applied field exists that exerts a force on the molecule. The force = ma, the product of the objects mass and its acceleration. However, in solution the force exerted on the molecule is quickly counteracted by the frictional force exerted by the solution on the molecule. This leads to a situation in which the net force on the molecule is zero (the acceleration falls to zero). The frictional force on a molecule is proportional to the size, shape and solvation on the molecule. When a molecule reaches its terminal velocity (no acceleration), the diffusion coefficient is simply related to the frictional coefficient:
where f = frictional coefficient, and k = Boltzmann's constant (1.3807x10⁻²³ J/K). This equation was derived by Einstein in his Ph.D. thesis, which he considered one of his lesser works.
For a sphere, Stokes derived a relation between the radius and the frictional coefficient:
where, h = viscosity of the solution, a measure of its resistance to flow. The viscosity of solutions is commonly measured in a unit called poise, where 1 poise = 1 g/cm-sec. The viscosity of water is 1 cP = 1.00x10⁻² g/cm-sec at 20oC.
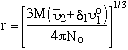
So, for a spherical molecule the relation between the measured diffusion coefficient and the radius is simply:
The viscosity of the solvent at specific temperature is known accurately for most common solvents. The diffusion coefficient can be measured by recording the concentration as a function of distance by Fick's First Law or it can be measured by a technique called laser scattering. However, there are some problems that can lead to erroneous results. The radius that we obtain is concentration dependent, because the diffusion coefficient is concentration dependent. This can be compensated for by measuring the diffusion coefficient as a function of concentration and extrapolating the results to zero concentration (Do).
The other problem that we face is different apparent molecular diameters due to solvation and non-spherical macromolecules. Solvation of a macromolecule can substantially increase the apparent diameter. A non-spherical shape will allow for greater resistance to flow and give an apparently higher size for the molecule. Fortunately, these effects can be determined experimentally.
In order t determine the size of the solvation shell, we must define a new quantity called the partial specific volume of the macromolecule. The operational definition of the partial molecular volume is:
where g2 equals the grams of solvent added to the macromolecule. An alternative way to view the partial specific volume is that it is equal to the volume of the macromolecule divided by the mass of the molecule. In terms of measurable parameters, the partial specific volume can be given by:
u2 = specific volume of the unsolvated molecule
d1 = grams of solvent per gram of macromolecule
u1 = specific volume of the solvent bound to the macromolecule
u1o = specific volume of the free solvent (1/density of the solvent)
For proteins, the specific volume is ~ 0.7-0.75 cm3/g and there are ~ 0.2-0.6 g H2O per gram of protein. This corresponds to about 600 mole of water per mole of protein!
For dsDNA, the specific volume is ~ 0.4-0.5 cm3/g and there are ~ 0.5-0.7 g H2O per gram of DNA.
If we set d1 =0 and u2 = u2, then we get the radius for the unsolvated sphere. We can compare the ratio of the radius from either calculation to get an estimate of the degree of solvation and the shape of the macromolecule.
For a solvated sphere:
For the unsolvated sphere:
The radius for the unsolvated sphere corresponds to the minimal frictional coefficient that can be obtained because a sphere has the least frictional drag and the unsolvated sphere is the smallest of all forms of the macromolecule. Thus, the unsolvated sphere can serve as the basis of comparison for all other possibilities that the macromolecule can exist in: unsolvated, or ellipsoidal. The symbol we choose for the solvated sphere is fo. We can derive a general relation between the measured, solvated and unsolvated frictional coefficients:
f = measured frictional coefficient
fo = spherical solvated frictional coefficient
fmin = spherical unsolvated frictional coefficient
The factor (f / fo) gives an idea of the shape of the molecule by comparison with calculated values for different shape ellipsoids.
Statistics deals with moments about the mean of Gaussian peaks to obtain information about the distribution and about the relative areas under the distribution. The second moment about the mean is the most important statistical function. The second moment is called the variance, s2. The square root of the variance is called the standard deviation and is a measure of the width of the Gaussian zone. Of course, in statistics, it is the standard deviation that tells us how widely spread our data is from a mean value. In chromatography, the standard deviation is an indication of how spread the molecules are from the mean position of the average of all molecules migrating through the separation column. For a Gaussian zone, s is the distance between the zone center (mean position of all molecules) and the inflection point of the peak. How can we relate these to a separtion?
As we showed earlier, the relation between the width of a peak and time is due to diffusion along the column. The longer the amount of time that a concentrated zone is allowed to sit, the greater its distribution over space. The Einstein relation tells us that the variance is proportional to the amount of time on the column:
So the longer time the separation takes, the greater the variance and the greater the spread of molecules from an ideal d peak.
Often, diffusion can take many forms in a separation:
1) longitudinal diffusion: the analytes diffuse along the column axis toward either end of the column.
2) eddy diffusion: two different analytes take different paths along a column due to obstructions in the flow profile such as solid particles.
3) lateral diffusion: the analytes difuse in a radial direction at different rates.
4) mass transfer: two analytes exchange at different rates with a liquid or quasi-liquid phase in the column.
It is a fundamental statistical law that if two processes contribute to diffusion independently, the total variance is the sum of the variances for each process. Notice, this does not say that the standard deviations are the sum of standard deviations.
From the Einstein relation, the diffusion coefficients must be directly additive:
So, in the Einstein relation, the diffusion coefficient may be a composite of different mechansims of broadening. We know that the distance a compound migrates is simply related to its velocity and the length of the column:
Substituting into the Einstein equation gives:
Now, we can define the term in parenthesis as a factor we call H, so that:
The parameter H is commonly called the height equivalent to a theoretical plate or the plate height. It is a measure of the efficiency of a separation. The smaller H, the less the dispersion and the better the separation. We can use a derived quantity called the number of theoretical plates which we define as:
Now if we can measure this quantity from the separation, we are set. Actually, it is quite easy to do so:
where tr is the migration time and W1/2 is the measured peak width at one half the height of the peak. Often in chromatography, we are not interested in how efficient a separation is, but how well we have resolved the peaks in our separation. The resolution is given simply by the distance between the peaks divided by the average peak width: