
Spectroscopy
|
Spectroscopy Emission | Absorption |
Emission spectroscopy measures the photons emitted by a molecule when it falls from its excited state to its more stable ground state. A molecule generally exists in its ground state but can be excited by a light wave, or photon. Each photon carries a certain amount of energy E where E=hn (h is Planck's constant =6.626*10^-34 J*s and n is frequency). When a molecule absorbs a photon it is promoted to a higher energy level or excited state. When a molecule is in this excited state there are several options that it has for releasing this extra energy to return to its ground state.
A molecule can release this excess energy through vibrations in the bonds holding the molecule together. It can lose energy through collisions with other molecules. In both of these cases the extra energy is given off as heat. Emission spectroscopy looks at another form of energy release, the emission of a photon. There are three primary types of emission spectroscopy; fluorescence, atomic emission, and phosphorescence.
In fluorescence spectroscopy molecules are excited by the appropriate wavelength of light to raise them to an excited state. In this state the molecule emits a photon of light that allows the molecule to come back to its ground state. This emitted light is measured by a detector and then used to determine analyte concentration. Fluorescence is fairly rare because generally molecules give off energy through vibrational energy in bonds. Fluorescence generally occurs in molecules with several aromatic rings that are unable to give off energy through vibration.
Fluorescence spectroscopy is a very important tool in biochemical research for several reasons. First fluorescence spectroscopy can accurately determine down to pico and femtomolar concentrations. Accurate detection of such small quantities is important in biological settings because small changes in ion concentrations can have significant physiological effects. Secondly, fluorescence can measure very rapid changes in concentration. Changes in fluorescence can be measured over picoseconds if necessary. Finally, fluorescence is a very safe technique. Fluorescence can be measured without any adverse effects on physiological behavior. This is of obvious importance to the biochemist. More information on fluorescence spectroscopy is available.
Atomic emission spectroscopy also measures light emitted by a molecule to determine analyte concentration. However, atomic emission atomizes samples by flame, discharge or plasma. These high temperature atomization sources have sufficient energy to excite the atoms to a higher energy level. The atoms then emit photons to return to their ground state and these emitted photons are then measured. For more information about the sources of atomization and all of atomic emission, Scimedia has great site with lots of pictures an information about atomic emission spectroscopy.
Atomic emission spectroscopy is not as widely used in biochemistry as fluorescence but it still has many applications. For example, atomic emission spectroscopy can be used to determine ion concentrations in many different physiological fluids.
Phosphorescence spectroscopy is very similar to fluorescence spectroscopy. The difference between the two depends on an event known as intersystem crossing. Intersystem crossing occurs when an excited molecule flips the spin on its electron when it is converted to a higher energy level. From this energy level (known as the T1 energy level) the molecule must flip the spin on the promoted electron back to its original spin in order for it to return to its ground state. As the excess energy is released to return to a ground state a photon of light is emitted. This is phosphorescence. Phosphorescence generally lasts longer than fluorescence based on the fact that it requires more time for the electron to flip its spin.
Phosphorescence is much rarer than fluorescence based on the fact that it requires the promoted electron to flip. This makes phosphorescence spectroscopy less common than fluorescence spectroscopy.
What is absorption spectroscopy?
When a molecule absorbs a photon of light, an electron becomes excited to a higher energy level. This decreases the amount of light that is being transimitted through a sample. It is then possible to measure the decrease in transmittance and to relate that value to an absorbance. Absorbances are characteristics of substances that are proportional to the concentration in a sample. They are also specific to a certain wavelength. A well known equation relates all of these things together.
Beer's Law: A = e l C
Where A is absorbance, E is molar absorptivity, L is the pathlength of sample, and C is the concentration of analyte. Absorbance is negative log of transmittance, while the molar absorptivity is a characteristic of a subtance telling how much light is absorbed at a particular wavelength.
Beer's Law is a very useful equation when doing absorption spectroscopy. However, it does sometimes fail. At very high concentrations oftentimes molecules will block others from being hit by incident light giving you a false reading. Also the sample will sometimes act as another prism bending the light which you are trying to detect. Varying solvents can somethings give incorrect measurements along whith chemical reactions occurring in the sample cuvette. Fingerprints on the surface serve as another culprit for poor results.
Why use absorption spectroscopy?
Absorption Spectroscopy is a wonderful technique for analytical chemists, among others. It is a rather simple method for determining the concentration of analyte in a solution. Typically, it can be run relatively quickly as well. Since certain molecules absorb different amounts at different wavelengths, it is somewhat arbitrary to determine unkown concentrations in a solution. Combinations of analytes in solution can also be measured and concentrations calculated just by looking at the spectrum. This is a little more involved mathematically as you must solve a system of equations.
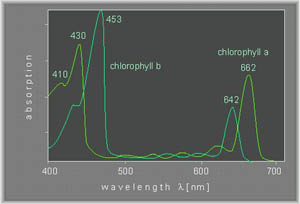
An example of a visible spectrum of chlorophyl a and b is shown below (Ref).
Techniques:
Spectroscopy, as the name implies, measures how different molecules affect light that hits them. There are a few different types of absorption spectroscopy. An excellent description of spectroscopic techniques can be found at the University of Kentucky's Analytical Spectroscopy Research Group. One of them simply measures the amount of light of a particular wavelength that passed through a sample. Known as UV-Vis, it can "see" into the ulraviolet and visible parts of the spectrum. There are other types of spectroscopy that can measure out into the infrared area of the spectrum as well. These instruments are usually separate from uv-vis instruments. Another type operates on the same priciple, however, it requires the particles become atomized in a flame. This is known as atomic absorption. There are many different types of spectroscopic instruments. Some are rather simple and mostly manual, while others are extremely automated. The choice of instrument often depends on the type of analysis one wishes to perform. Protein assays are often done at a single wavelength with simple spectrophotometers, like a Spec 21. Atomic absorption is a very popular choice for many determinations because of its high sensitivity and ability to perform simultaneous multielement analyses. It also is capable of measuring concentrations at the parts per million level and oftentimes even less.
An excellent place to gain familiarity with many techniques is with Agilent Technologies Fundamentals of Modern UV-visible Spectroscopy - A Workbook (Pub # 5967-6357E). A hard copy of the workbook can be purchased or you can download a free copy from the Agilent WWW site.
Recent reviews of absorption spectroscopic techniques for biological and environmental applications:
Interaction of chlorpromazine and trifluoperazine with ionic micelles: electronic absorption spectroscopy studies. Author: Caetano, W., and others Source: Spectrochim. Acta, Part A Elsevier Science B.V. 55A, no. 12 (1999): 2513-2528
Using the Decay of Incorporated Photoexcited Triplet Probes to Study Unilamellar Phospholipid Bilayer Membranes. Author: Baranyai, Peter, and others Source: Langmuir American Chemical Society 15, no. 22 (1999): 7577-7584
Optical methods for detection of gas pollutants. Author: Zientkiewicz, Jacek K., and others Source: Proc. SPIE-Int. Soc. Opt. Eng. SPIE-The International Society for Optical Engineering 3731, no. Optical Fibers and Their Applications VI (1999): 156-160
A quantitative model for using acridine orange as a transmembrane pH gradient probe. Author: Clerc, Stephane, and others Source: Anal. Biochem. Academic Press 259, no. 1 (1998): 104-111 (ChemAbsStudent)
Absorption spectroscopy labs from the Journal of Chemical Education relating to biochemistry:
Gilles de Pelichy, Laruent D.; Adam, Carl; Smith, Eugene T. Analysis of the Essential Nutrient Strontium in Marine Aquariums. by Atomic Absorption Spectroscopy: An Undergraduate Analytical Chemistry Laboratory Exercise J. Chem. Educ. 1997 74 1192. (October 1997)
Shah, S. Sadiq; Henscheid, Leonard G. Absorption spectroscopy in homogeneous and micellar solutions. J. Chem. Educ. 1983 60 685.
Pomeroy, Roland K.; Drikitis, Nikolajs; Koga, Yoshikata. The determination of zinc in hair using atomic absorption spectroscopy. J. Chem. Educ. 1975 52 544.
Penzer, G. R. Applications of absorption spectroscopy in biochemistry. J. Chem. Educ. 1968 45 692.
Stolzberg, Richard Screening. Sequential Experimentation: Simulations and Flame Atomic Absorption Spectrometry Experiments. J. Chem. Educ. 1997 74 216. (February 1997)
Abney, James R., and others, Saving your student's skin. Undergraduate experiments that probe UV protection by sunscreens and sunglasses. J. Chem. Educ. 75, no. 6, (1998): 757-760
References:
http://www.rrz.uni-hamburg.de/biologie/b_online/e24/3.htm
page designed by Henry Luther Gray